Linear regression is the relation between variables when the regression equation is linear: e.g., y = ax + b
Linear regression – basic assumptions
- Variance is constant
- You are summarizing a linear trend
- You have all the right terms in the model
- There are no big outliers
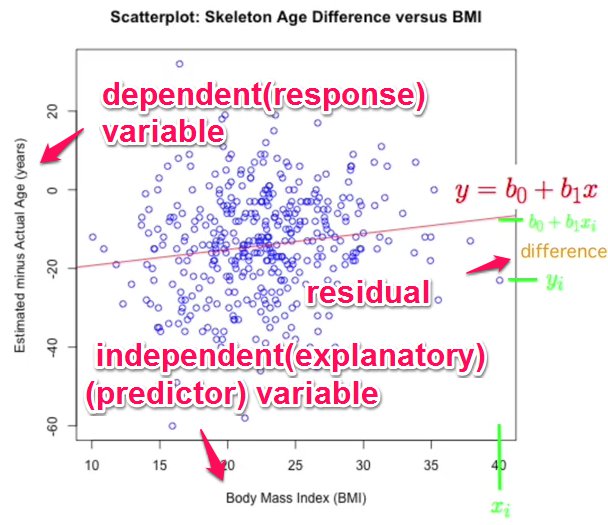
Referring to the picture above, intention is to come up with the best values of b0 & b1 to derive the line which best describes the data
WRT picture below, For the line of best fit, we like to make the residuals (difference) as less as possible
residual = actual value – predicted value

If we add up the +ves and -ves then we get 0. So we have to square both residuals and then add them.
So in effect we have to make the SS (sum of squares) as less as possible by taking the best values of b0 and b1. This is also called basic least squares.
Using calculus we can derive b0 and b1 (formulas are not noted here)
b0 is called the intercept and b1 is the slope.
eg b0 – intercept – how much we have to shift the line to get the line of best fit. Interpretation of the intercept doesn’t make sense in the real world. Eg x has to be 0 for the intercept value to be known.
b1 – slope – if bmi increases x, then estimated age increase (bo+b1x)
Regression is not symmetric. That is – if the dependent and independent variables are swapped, the slope is not the reciprocal , but has a different value.
Covariance and Correlation describe how two variables are related.
- Variables are positively related if they move in the same direction.
- Variables are inversely related if they move in opposite directions.
Both covariance and correlation indicate whether variables are positively or inversely related. Correlation also tells you the degree to which the variables tend to move together.
Covariance indicates how two variables are related. A positive covariance means the variables are positively related, while a negative covariance means the variables are inversely related.
Eg . Measures like variance and SD are purely 1-dimensional. Data sets like this could be: heights of all the people in the room, marks for the last exam etc. However many data sets have more than one dimension, and Covariance lets us see if there is any relationship between the dimensions. For example, we might have as our data set both the height of all the students in a class, and the mark they received for that paper. We could then perform
statistical analysis to see if the height of a student has any effect on their mark. Standard deviation and variance only operate on 1 dimension, so that you could only calculate the standard deviation for each dimension of the data set independently of the other dimensions. However, it is useful to have a similar measure to find out how
much the dimensions vary from the mean with respect to each other. Covariance is such a measure. If you calculate the covariance between one dimension and itself, you get the variance.
If we have a data set with more than 2 dimensions, there is more than one covariance measurement that can
be calculated. For example, from a 3 dimensional data set (dimensions x,y,z) you could calculate cov(x,y), cov(x,z) and cov(y,z). A useful way to get all the possible covariance values between all the different dimensions is to calculate them all and put them in a matrix.
For an imaginary 3 dimensional data set, using the usual dimensions x, y and z

Down the main diagonal, you see that the covariance value is between one of the dimensions and itself. These are the variances for that dimension. The other point is that since cov(a,b)=cov(b,a), the matrix is symmetrical about the
main diagonal
Correlation is another way to determine how two variables are related. In addition to telling you whether variables are positively or inversely related, correlation also tells you the degree to which the variables tend to move together.
Covariance measures variables that have different units of measurement. Using covariance, you could determine whether units were increasing or decreasing, but it was impossible to measure the degree to which the variables moved together because covariance does not use one standard unit of measurement. To measure the degree to which variables move together, you must use correlation.
The correlation measurement, called a correlation coefficient, will always take on a value between 1 and – 1:
- If the correlation coefficient is one, the variables have a perfect positive correlation. This means that if one variable moves a given amount, the second moves proportionally in the same direction. A positive correlation coefficient less than one indicates a less than perfect positive correlation, with the strength of the correlation growing as the number approaches one.
- If correlation coefficient is zero, no relationship exists between the variables. If one variable moves, you can make no predictions about the movement of the other variable; they are uncorrelated.
- If correlation coefficient is –1, the variables are perfectly negatively correlated (or inversely correlated) and move in opposition to each other. If one variable increases, the other variable decreases proportionally. A negative correlation coefficient greater than –1 indicates a less than perfect negative correlation, with the strength of the correlation growing as the number approaches –1.
Correlation and regression are similar because we use both to analyze the relationship between two continuous variables.
Correlation is used to analyze the association between two measured variables. Regression is used when you have manipulated a continuous variable in an experiment and want to test its effect on a normally-distributed response variable.
Difference between Covariant and variables
Eg – A movie collection is a covariant but various types of movies “PG”, “R” etc are variables.
Does linear regression analysis explain the relationship between 2 variables ?
Or is there anything else we need to know.

since there is no particular pattern among residuals, the linear regression is telling something about the X & Y (scatter graph of X & Y)

Linear regression is not describing the whole story since the residuals are skewed.
In such cases we need to do a “transformation”. The most common transformation is the logarithm. Eg logarithm to the base 10 of X (in the original data scatter plot – not in the residuals regression plot). It smoothes things out.
So the linear relationship is not between the variables, but between a variable and the logarithm of the other variable.
Regression with Factors

If we do an “as.factor”, these are coerced to factors, and instead of quantitative, the averages are calculated

If you want to reorder the factors, you have to relevel wrt to factor. Then the coefficients are recalculated wrt to the provided factor
Dummy Variables
A Dummy variable or Indicator Variable is an artificial variable created to represent an attribute with two or more distinct categories/levels. eg : The dummy variable Y1990 represents the binary independent variable ‘Before/After 1990’. Thus, it takes two values: ‘1’ if a house was built after 1990 and ‘0’ if it was built before 1990. Thus, a single dummy variable is needed to represent a variable with two levels
Limitations of Linear Regression

Linear regression cannot be used to explain all relationships. Eg the relationship may be quadratic.
Eg in the picture, the linear regression is same in all cases
Even further, sometimes when know means, variances, lines of best fit and correlations etc, we still cant explain the data. we have to look at it graphically.
Not resistant to outliers. Not robust.
Disclaimer : These are my study notes – online – instead of on paper so that others can benefit. In the process I’ve have used some pictures / content from other original authors. All sources / original content publishers are listed below and they deserve credit for their work. No copyright violation intended.
References for these notes :
- Wonderful video explaining the concept http://www.youtube.com/watch?v=aq8VU5KLmkY
- The study material for the MOOC “Making sense of data” at Coursera.org
- http://www.cs.otago.ac.nz/cosc453/student_tutorials/principal_components.pdf

Leave a comment